Kmeans
The kmeans() function performs a segmentation on a DataCube using KMeans clustering.
Example
This examples shows the clustering of a synthetic generated DataCube.
 1import wizard
 2from wizard._utils.example import generate_pattern_stack
 3from wizard._processing.cluster import kmeans
 4import matplotlib.pyplot as plt
 5
 6# generate synthetic data with spatial patterns
 7data = generate_pattern_stack(20, 250, 350, n_circles=3, n_rects=3, n_triangles=2)
 8
 9# create a DataCube
10dc = wizard.DataCube(data)
11
12# apply plain KMeans clustering
13labels_km = kmeans(dc, n_clusters=4, n_init=25)
14
15# visualize a wavelength slice and the segmentation
16fig, axes = plt.subplots(1, 2, figsize=(10, 5))
17
18axes[0].imshow(dc[12])
19axes[0].set_title("Original Slice (λ index 12)")
20axes[0].set_axis_off()
21
22axes[1].imshow(labels_km)
23axes[1].set_title("Segmented (KMeans)")
24axes[1].set_axis_off()
25
26plt.tight_layout()
27plt.show()
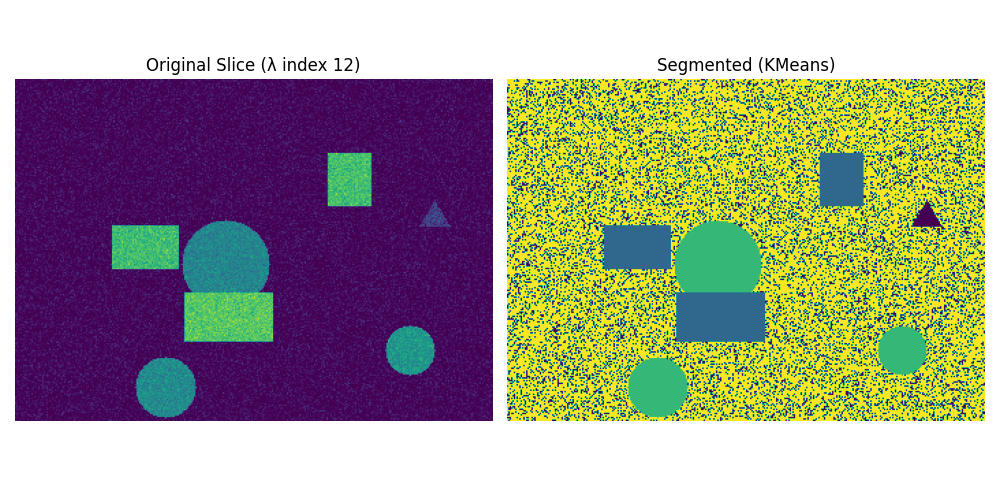
The output demonstrates an example segmentation with Kmeans.