Spatial Agglomerative Cluster
The spatial_agglomerative_clustering() function segments a :class:DataCube by performing hierarchical agglomerative clustering on its spectral signatures with spatial connectivity constraints.
Warning
Agglomerative clustering with spatial connectivity is conceptually elegant, but it doesn’t scale well to large 2D grids, and processing very large datasets can lead to high computing time.
Example
The following example demonstrates spatial agglomerative clustering on a synthetically generated DataCube.
 1import wizard
 2from wizard._utils.example import generate_pattern_stack
 3from wizard._processing.cluster import spatial_agglomerative_clustering, pca
 4import matplotlib.pyplot as plt
 5
 6# generate synthetic data with spatial patterns
 7data = generate_pattern_stack(8, 150, 150, n_circles=2, n_rects=4, n_triangles=3)
 8
 9# create a DataCube
10dc = wizard.DataCube(data)
11
12# visualize a wavelength slice and the segmentation
13fig, axes = plt.subplots(1, 2, figsize=(10, 5))
14
15axes[0].imshow(dc[4])
16axes[0].set_title("Original Slice (λ index 4)")
17axes[0].set_axis_off()
18
19# pca, because agglomerative donst scale well
20dc_reduced = pca(dc, n_components=2)
21
22# apply spatially-constrained agglomerative clustering
23labels_agg = spatial_agglomerative_clustering(dc_reduced, n_clusters=7)
24
25axes[1].imshow(labels_agg)
26axes[1].set_title("Segmented (Agglomerative + Spatial)")
27axes[1].set_axis_off()
28
29plt.tight_layout()
30plt.show()
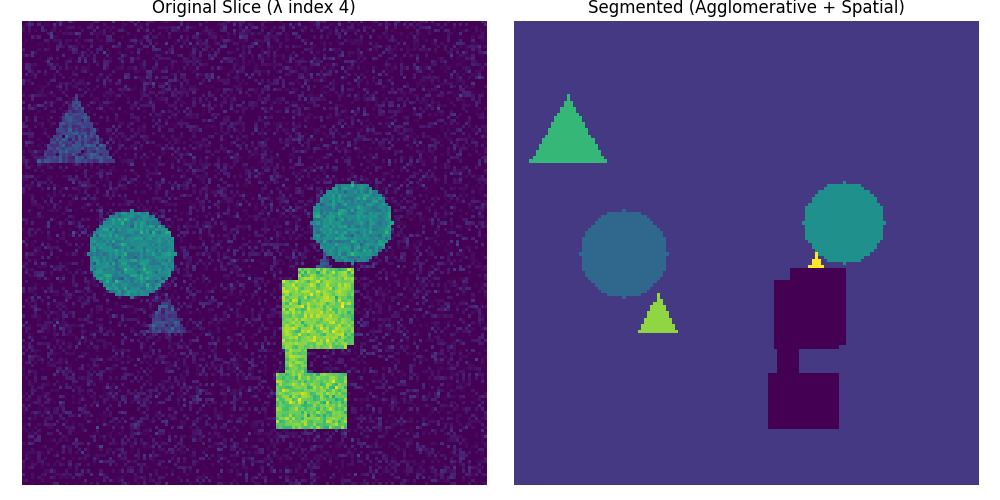
The output illustrates how the algorithm merges spectrally similar and spatially adjacent regions, yielding a smooth and interpretable segmentation reflecting both spectral and spatial continuity.