Isodata
The isodata() function segments a :class:DataCube using the ISODATA algorithm—a variant of KMeans that iteratively splits and merges clusters based on spectral variance and cluster population.
Example
The following example illustrates the use of isodata() on a synthetically generated DataCube.
 1import wizard
 2from wizard._utils.example import generate_pattern_stack
 3from wizard._processing.cluster import isodata
 4import matplotlib.pyplot as plt
 5
 6# generate synthetic data with spatial patterns
 7data = generate_pattern_stack(15, 300, 300, n_circles=4, n_rects=2, n_triangles=2)
 8
 9# create a DataCube
10dc = wizard.DataCube(data)
11
12# apply ISODATA clustering
13labels_iso = isodata(dc, k=5, it=25, p=4)
14
15# visualize a wavelength slice and the segmentation
16fig, axes = plt.subplots(1, 2, figsize=(10, 5))
17
18axes[0].imshow(dc[10])
19axes[0].set_title("Original Slice (λ index 10)")
20axes[0].set_axis_off()
21
22axes[1].imshow(labels_iso)
23axes[1].set_title("Segmented (ISODATA)")
24axes[1].set_axis_off()
25
26plt.tight_layout()
27plt.show()
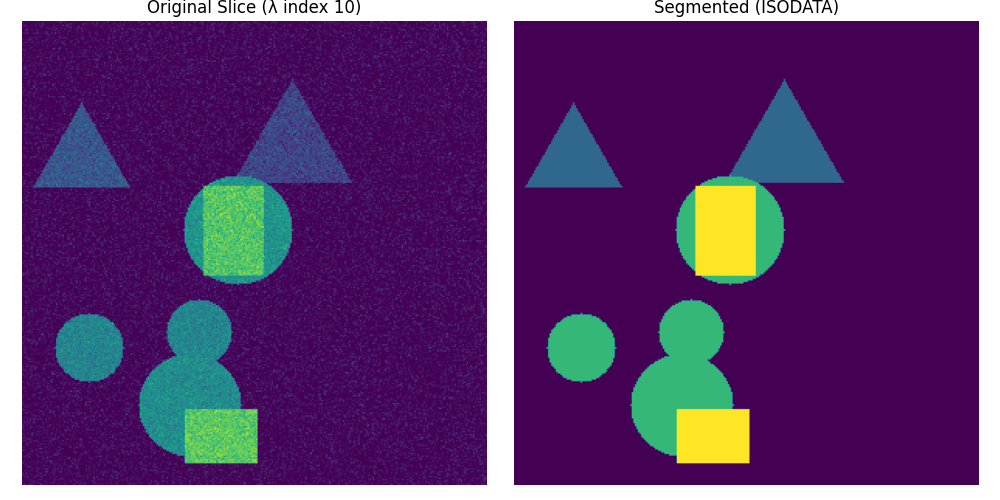
The output shows how ISODATA adaptively determines cluster counts and captures both subtle and broad spectral patterns within spatially coherent regions.