Use and Create Template
This section demonstrates how to create and use templates in the hsi-wizard framework for processing a DataCube. Templates help automate and reuse preprocessing workflows.
Create a Template
The following example shows how to create a processing template. We generate synthetic image data, apply a sequence of transformations (like resizing and background removal), and save the recorded operations into a template file.
 1import wizard
 2from wizard._utils.example import generate_pattern_stack
 3import matplotlib.pyplot as plt
 4
 5# Prepare plot
 6fig, axes = plt.subplots(1, 2, figsize=(10, 8))
 7
 8# Create synthetic data and initialize DataCube
 9data1 = generate_pattern_stack(20, 300, 300, n_circles=10, n_rects=0, n_triangles=0, seed=42)
10dc1 = wizard.DataCube(data1)
11
12# Plot before processing
13axes[0].imshow(dc1.cube[10], cmap='viridis', aspect='auto')
14axes[0].set_title("Before Processing DC1")
15
16# Record and apply processing
17dc1.start_recording()
18dc1.resize(x_new=500, y_new=300)
19dc1.remove_background()
20
21# Plot after processing
22axes[1].imshow(dc1.cube[10], cmap='viridis', aspect='auto')
23axes[1].set_title("After Processing DC1")
24
25# Save template for reuse
26dc1.save_template("template.yml")
27
28# show data
29plt.tight_layout()
30plt.show()
The figure below shows the effect of preprocessing. The left image represents a slice of the data cube before processing, while the right image shows the same slice after applying the recorded operations.
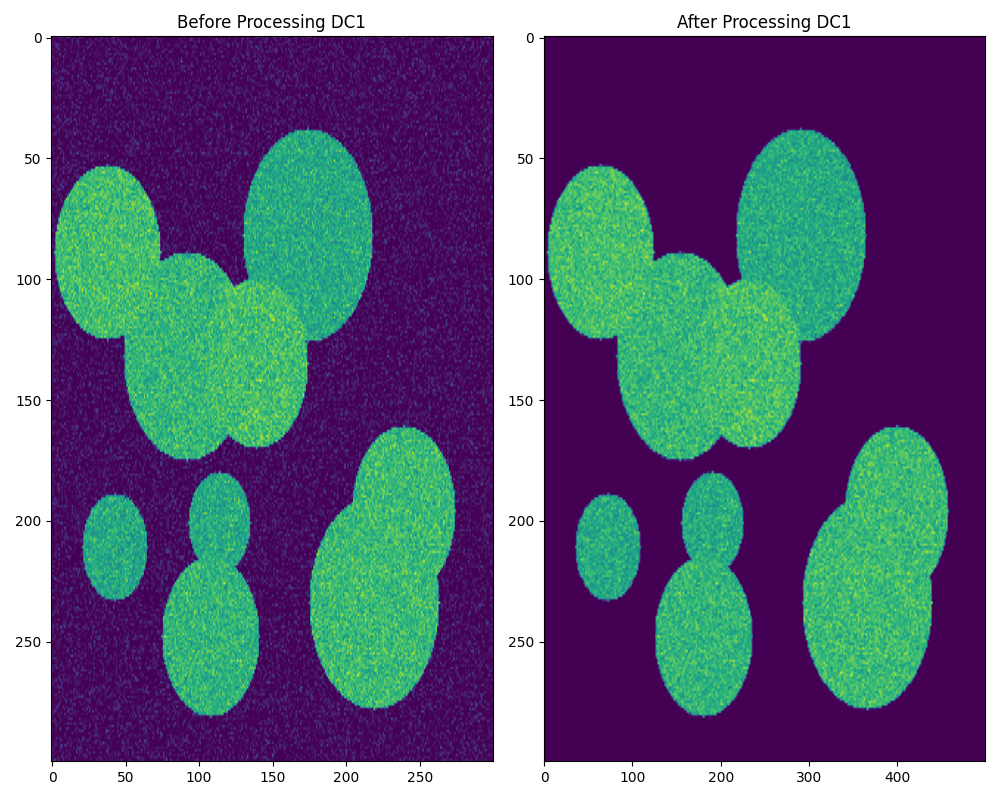
Visualizing the preprocessing steps on synthetic data.
Use a Template
Once a template has been created, it can be applied to new data sets to ensure consistent preprocessing. The example below demonstrates how to load and apply a saved template to another DataCube.
 1import wizard
 2from wizard._utils.example import generate_pattern_stack
 3import matplotlib.pyplot as plt
 4
 5fig, axes = plt.subplots(1, 2, figsize=(10, 8))
 6
 7# Apply template to new DataCube
 8# Create synthetic data and initialize DataCube
 9data2 = generate_pattern_stack(20, 300, 300, n_circles=10, n_rects=0, n_triangles=0, seed=43)
10dc2 = wizard.DataCube(data2)
11
12# Plot before processing
13axes[0].imshow(dc2.cube[10], cmap='viridis', aspect='auto')
14axes[0].set_title("Before Processing DC2")
15
16dc2.execute_template("template.yml")
17
18# Plot after processing
19axes[1].imshow(dc2.cube[10], cmap='viridis', aspect='auto')
20axes[1].set_title("After Processing DC2")
21
22# Show final plot
23plt.tight_layout()
24plt.show()
The figure below shows the results of applying the template to a new data set.
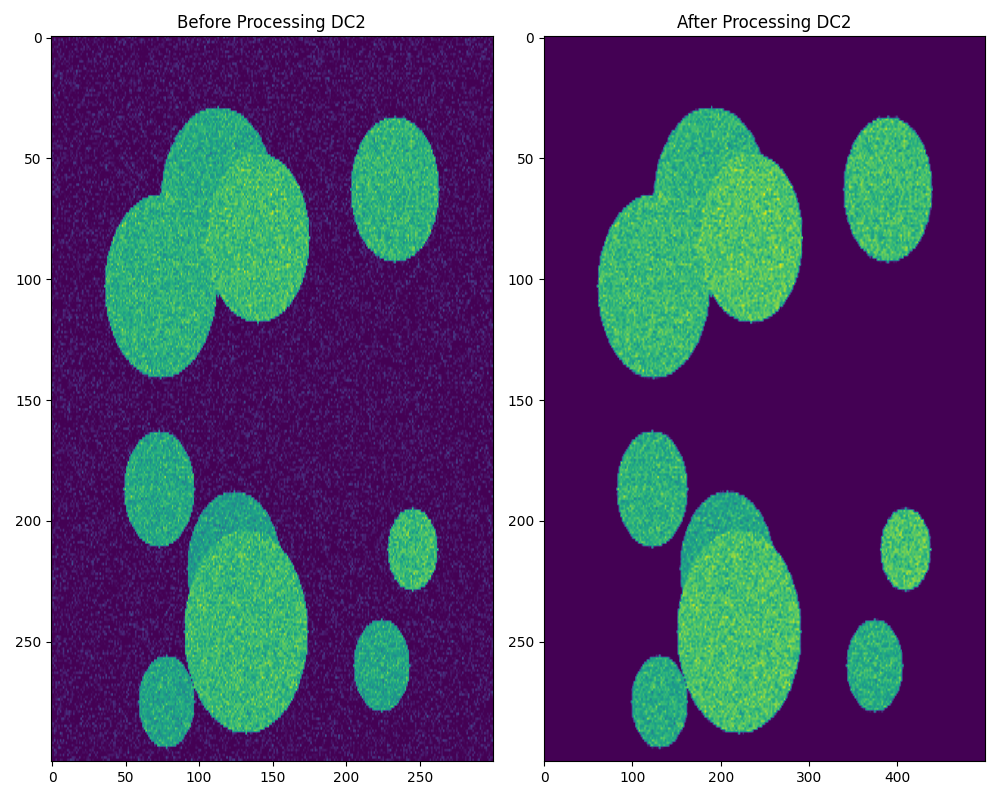
Applying a saved processing template for consistent analysis.