Resize
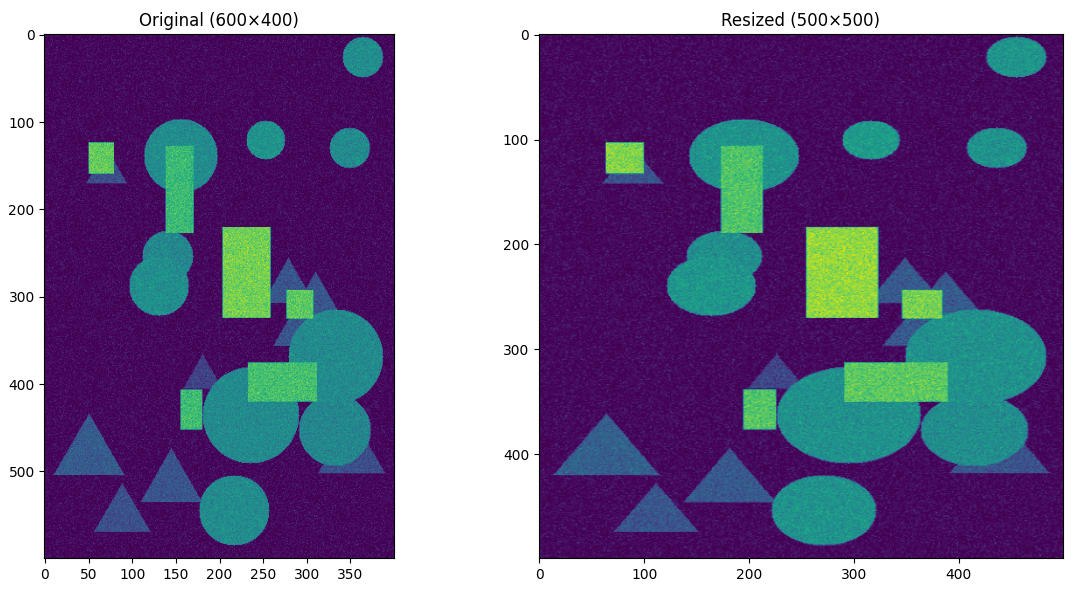
The resize() method adjusts the spatial dimensions of a DataCube to a new width and height by interpolating each spectral layer. It preserves the original spectral resolution (the wavelength axis) while changing the pixel grid to the user-specified size.
Note
Apart from resize(), the DataCube class provides many other operations. See DataCube Operations for details.
Example
Below is an example that loads a sample data cube, resizes it to half its original width and height, and then displays one of the wavelength slices.
 1import wizard
 2from wizard._utils.example import generate_pattern_stack
 3from matplotlib import pyplot as plt
 4
 5# generate random data
 6data = generate_pattern_stack(20, 600, 400, seed=123)
 7
 8# build two cubes: one original, one to resize
 9dc = wizard.DataCube(data)
10
11# plot them side by side
12fig, axes = plt.subplots(1, 2, figsize=(12, 6))
13
14# original
15axes[0].imshow(dc[10])
16axes[0].set_title("Original (600×400)")
17
18dc.resize(500, 500)
19
20# resized
21axes[1].imshow(dc[10])
22axes[1].set_title("Resized (500×500)")
23
24plt.tight_layout()
25plt.show()