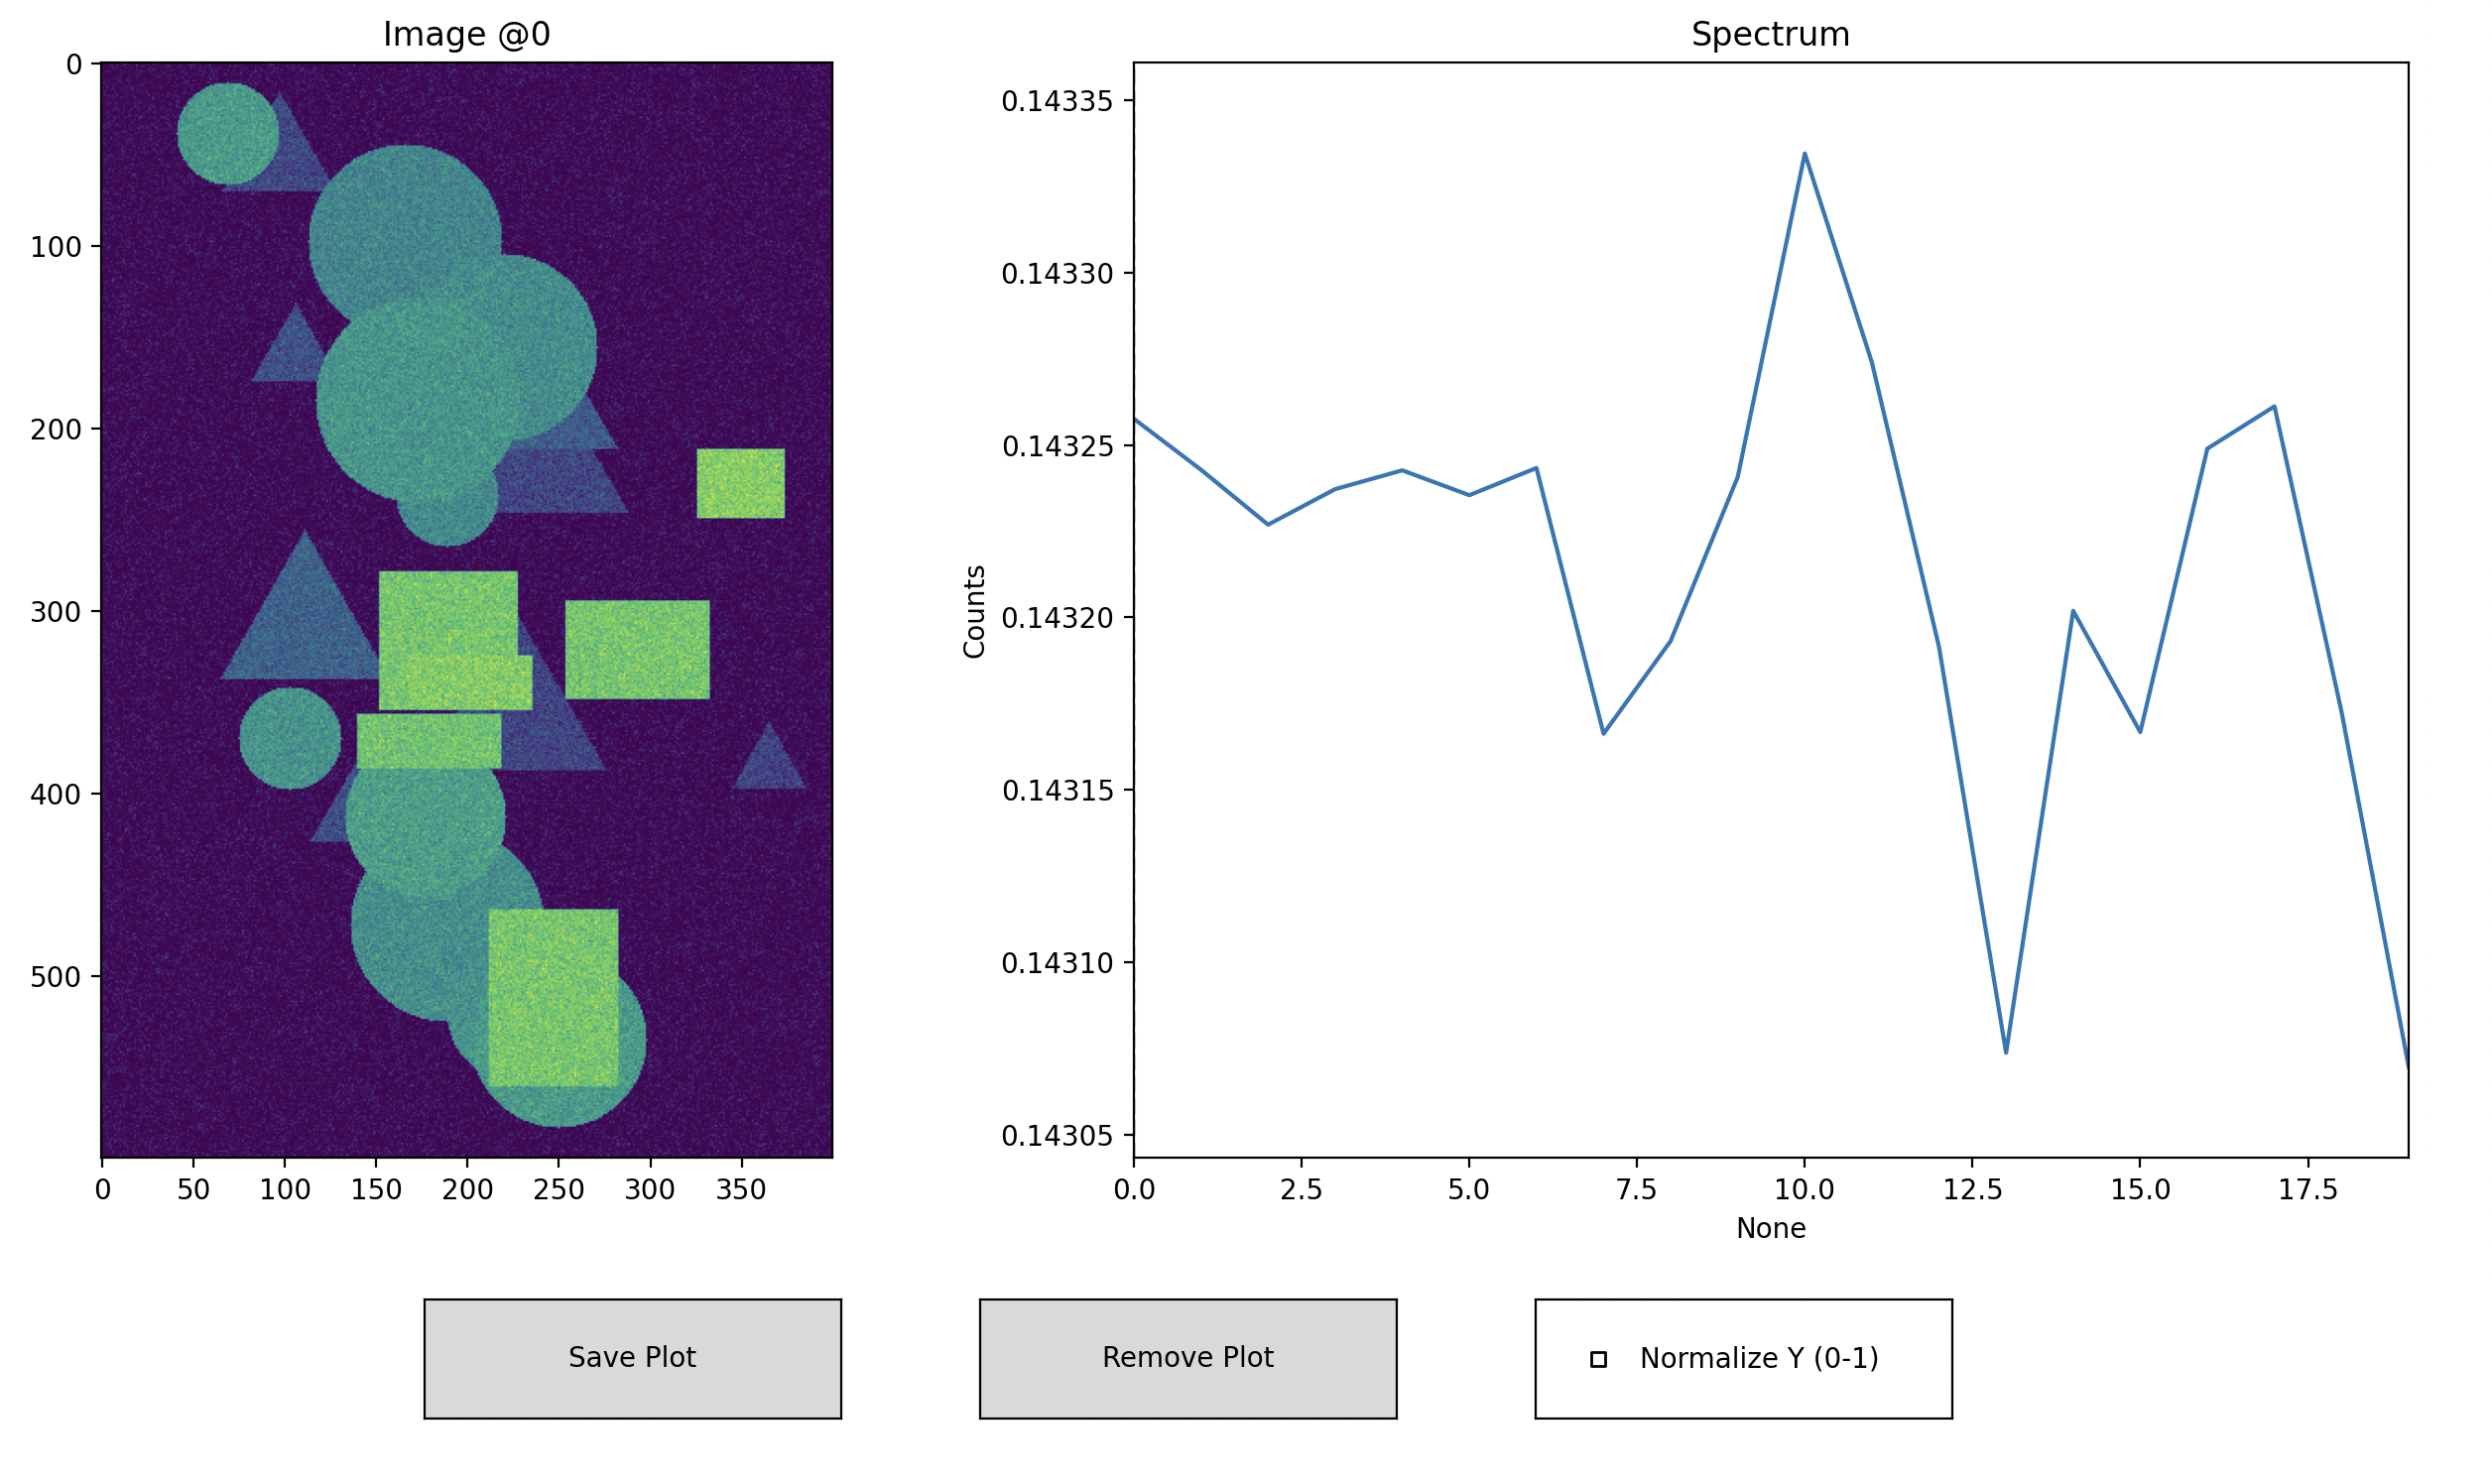
Plot DataCube
hsi-wiard ships with an interactive viewer for DataCube objects, allowing you to scroll through spectral layers, define ROIs, and overlay mean spectra.
Actions
← / → : Step through wavelength layers
Click (image panel) : Select single-pixel ROI
Drag (image panel) : Draw rectangular ROI
Click (spectrum panel) : Jump to nearest wavelength
Save Plot : Overlay and save current ROI mean spectrum
Remove Plot : Remove last saved spectrum and ROI overlay
Normalize Y (0–1) : Toggle y-axis normalization of all spectra
Example
import wizard
from wizard._utils.example import generate_pattern_stack

# generate randome data
data = generate_pattern_stack(20, 600, 400)

# creating some radnome data
dc = wizard.DataCube(data)

# plot data
wizard.plotter(dc)