Surface Plotter
Overview
The Surface Plotter module offers an interactive 3D visualization interface for DataCube objects. By combining slicing, threshold-based opacity control, and real-time rotation, it enables in-depth exploration of spatial and spectral features in chemical imaging datasets. This tool is particularly useful for applications such as mapping molecule concentration gradients in engineering processes.
Function: wizard.plot_surface(dc)
- wizard._exploration.surface.plot_surface(dc, index=0)[source]
Create an interactive 3D surface plot from a DataCube slice.
This function visualizes a DataCube by plotting a 3D surface of a selected spectral band. Users can manipulate two sliders: one to change the wavelength index (spectral band) and another to adjust the normalized cut-off threshold, updating the plot in real time.
- Parameters:
dc (DataCube) – DataCube instance
index (int, optional) – Initial spectral index to display (default is 0).
- Return type:
None
Notes
The wavelength slider is labeled with actual wavelength values at evenly
spaced ticks. - The cut-off slider normalizes data slices between 0 and 1 before thresholding. - Use the sliders to explore spectral variation and mask out low-intensity regions.
Examples
>>> import wizard
>>> dc = wizard.DataCube(np.random.rand(10, 100, 100), wavelengths=list(np.linspace(400, 700, 10)))
>>> wizard.plot_surface(dc, index=5)
Paper Reference
The Surface Plotter was employed in the study Three-Dimensional, Molecule-Sensitive Mapping of Structured Falling Liquid Films Using Raman Scanning. Below is the graphical abstract linked to the full paper:

Three-Dimensional, Molecule-Sensitive Mapping of Structured Falling Liquid Films Using Raman Scanning, by Nachtmann et al.
Example Usage
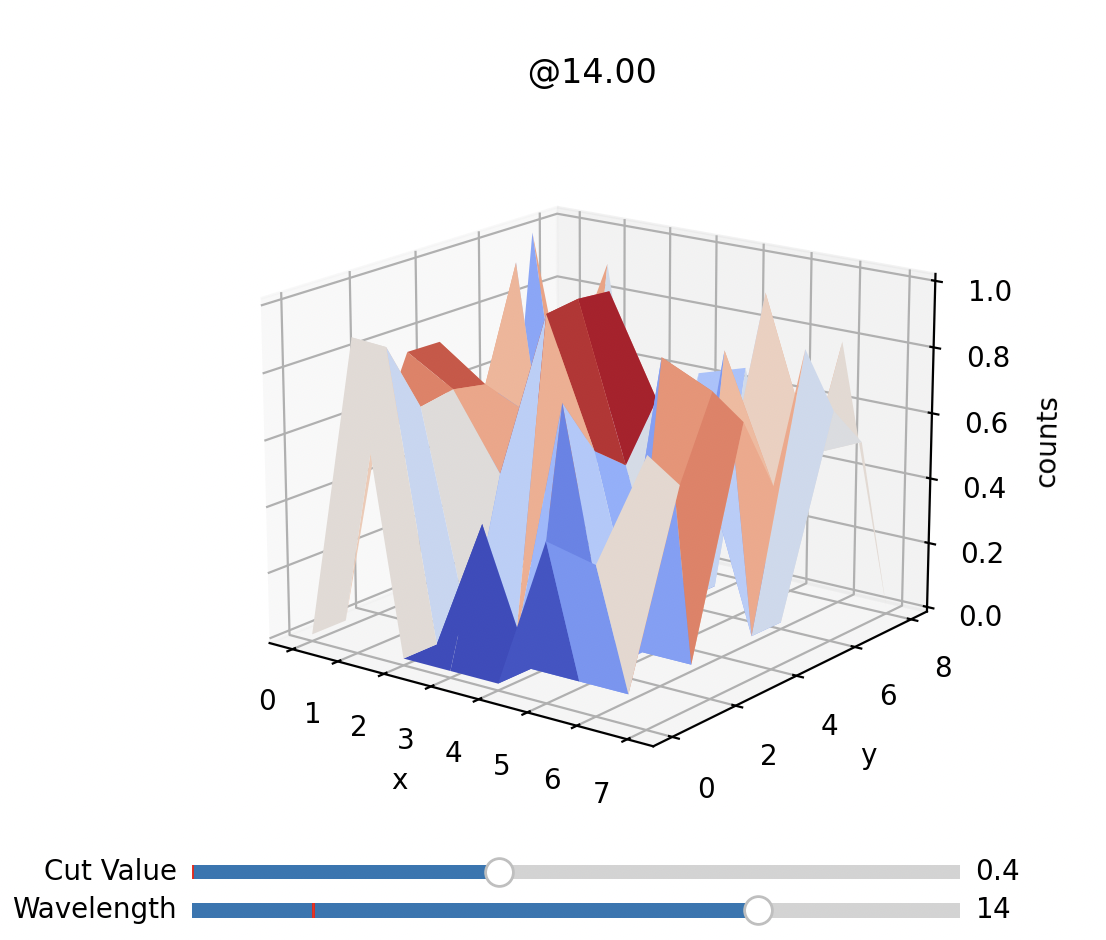
Example of the surface plotter function in action.