Plotter
Module Overview
The plotter module provides an interactive visualization interface for DataCube objects in the HSI Wizard package. Users can step through wavelength layers, define regions of interest (ROIs), compute mean spectra, normalize data, and save or remove ROI-based spectral plots.
Interactive Controls
Left/Right arrow keys: Step through wavelength layers.
Mouse click on image panel: Select a single-pixel ROI at the cursor location.
Rectangle drag on image panel: Define a custom ROI region.
Click on spectrum panel: Jump to the nearest wavelength layer based on clicked wavelength.
Save Plot button: Save the current ROI mean spectrum, overlaid with a unique semi-transparent color.
Remove Plot button: Remove the most recently saved ROI spectrum and its rectangle overlay.
Normalize Y (0–1) checkbox: Toggle normalization of all spectra on the Y-axis between 0 and 1.
Function: wizard.plotter(dc)
- wizard._exploration.plotter.plotter(dc)[source]
Launch an interactive plotting interface for a DataCube.
This function creates a Matplotlib window with two panels: an image view of a single spectral layer and a spectral plot of a selected ROI. Users can navigate layers, draw or click ROIs, and manage saved spectra with GUI controls.
- Parameters:
dc (DataCube) – A DataCube object with attributes: - cube: numpy array of shape (v, y, x) representing spectral data. - wavelengths: sequence of length v with corresponding wavelengths. - notation: string to annotate wavelength axis labels.
- Returns:
The function displays an interactive Matplotlib window and does not return a value. All interactions modify the displayed figure directly.
- Return type:
None
Notes
Keyboard and mouse interactions are captured via Matplotlib event handlers. ROI mean spectra are recalculated on-the-fly when ROI or normalization changes.
Examples
>>> import wizard
>>> import numpy as np
>>> dc = wizard.DataCube(np.random.rand(20, 8, 9))
>>> wizard.plotter(dc)
Example Usage
The following example demonstrates how to use the plotter function:
 1import wizard
 2from wizard._utils.example import generate_pattern_stack
 3
 4# generate randome data
 5data = generate_pattern_stack(20, 600, 400)
 6
 7# creating some radnome data
 8dc = wizard.DataCube(data)
 9
10# plot data
11wizard.plotter(dc)
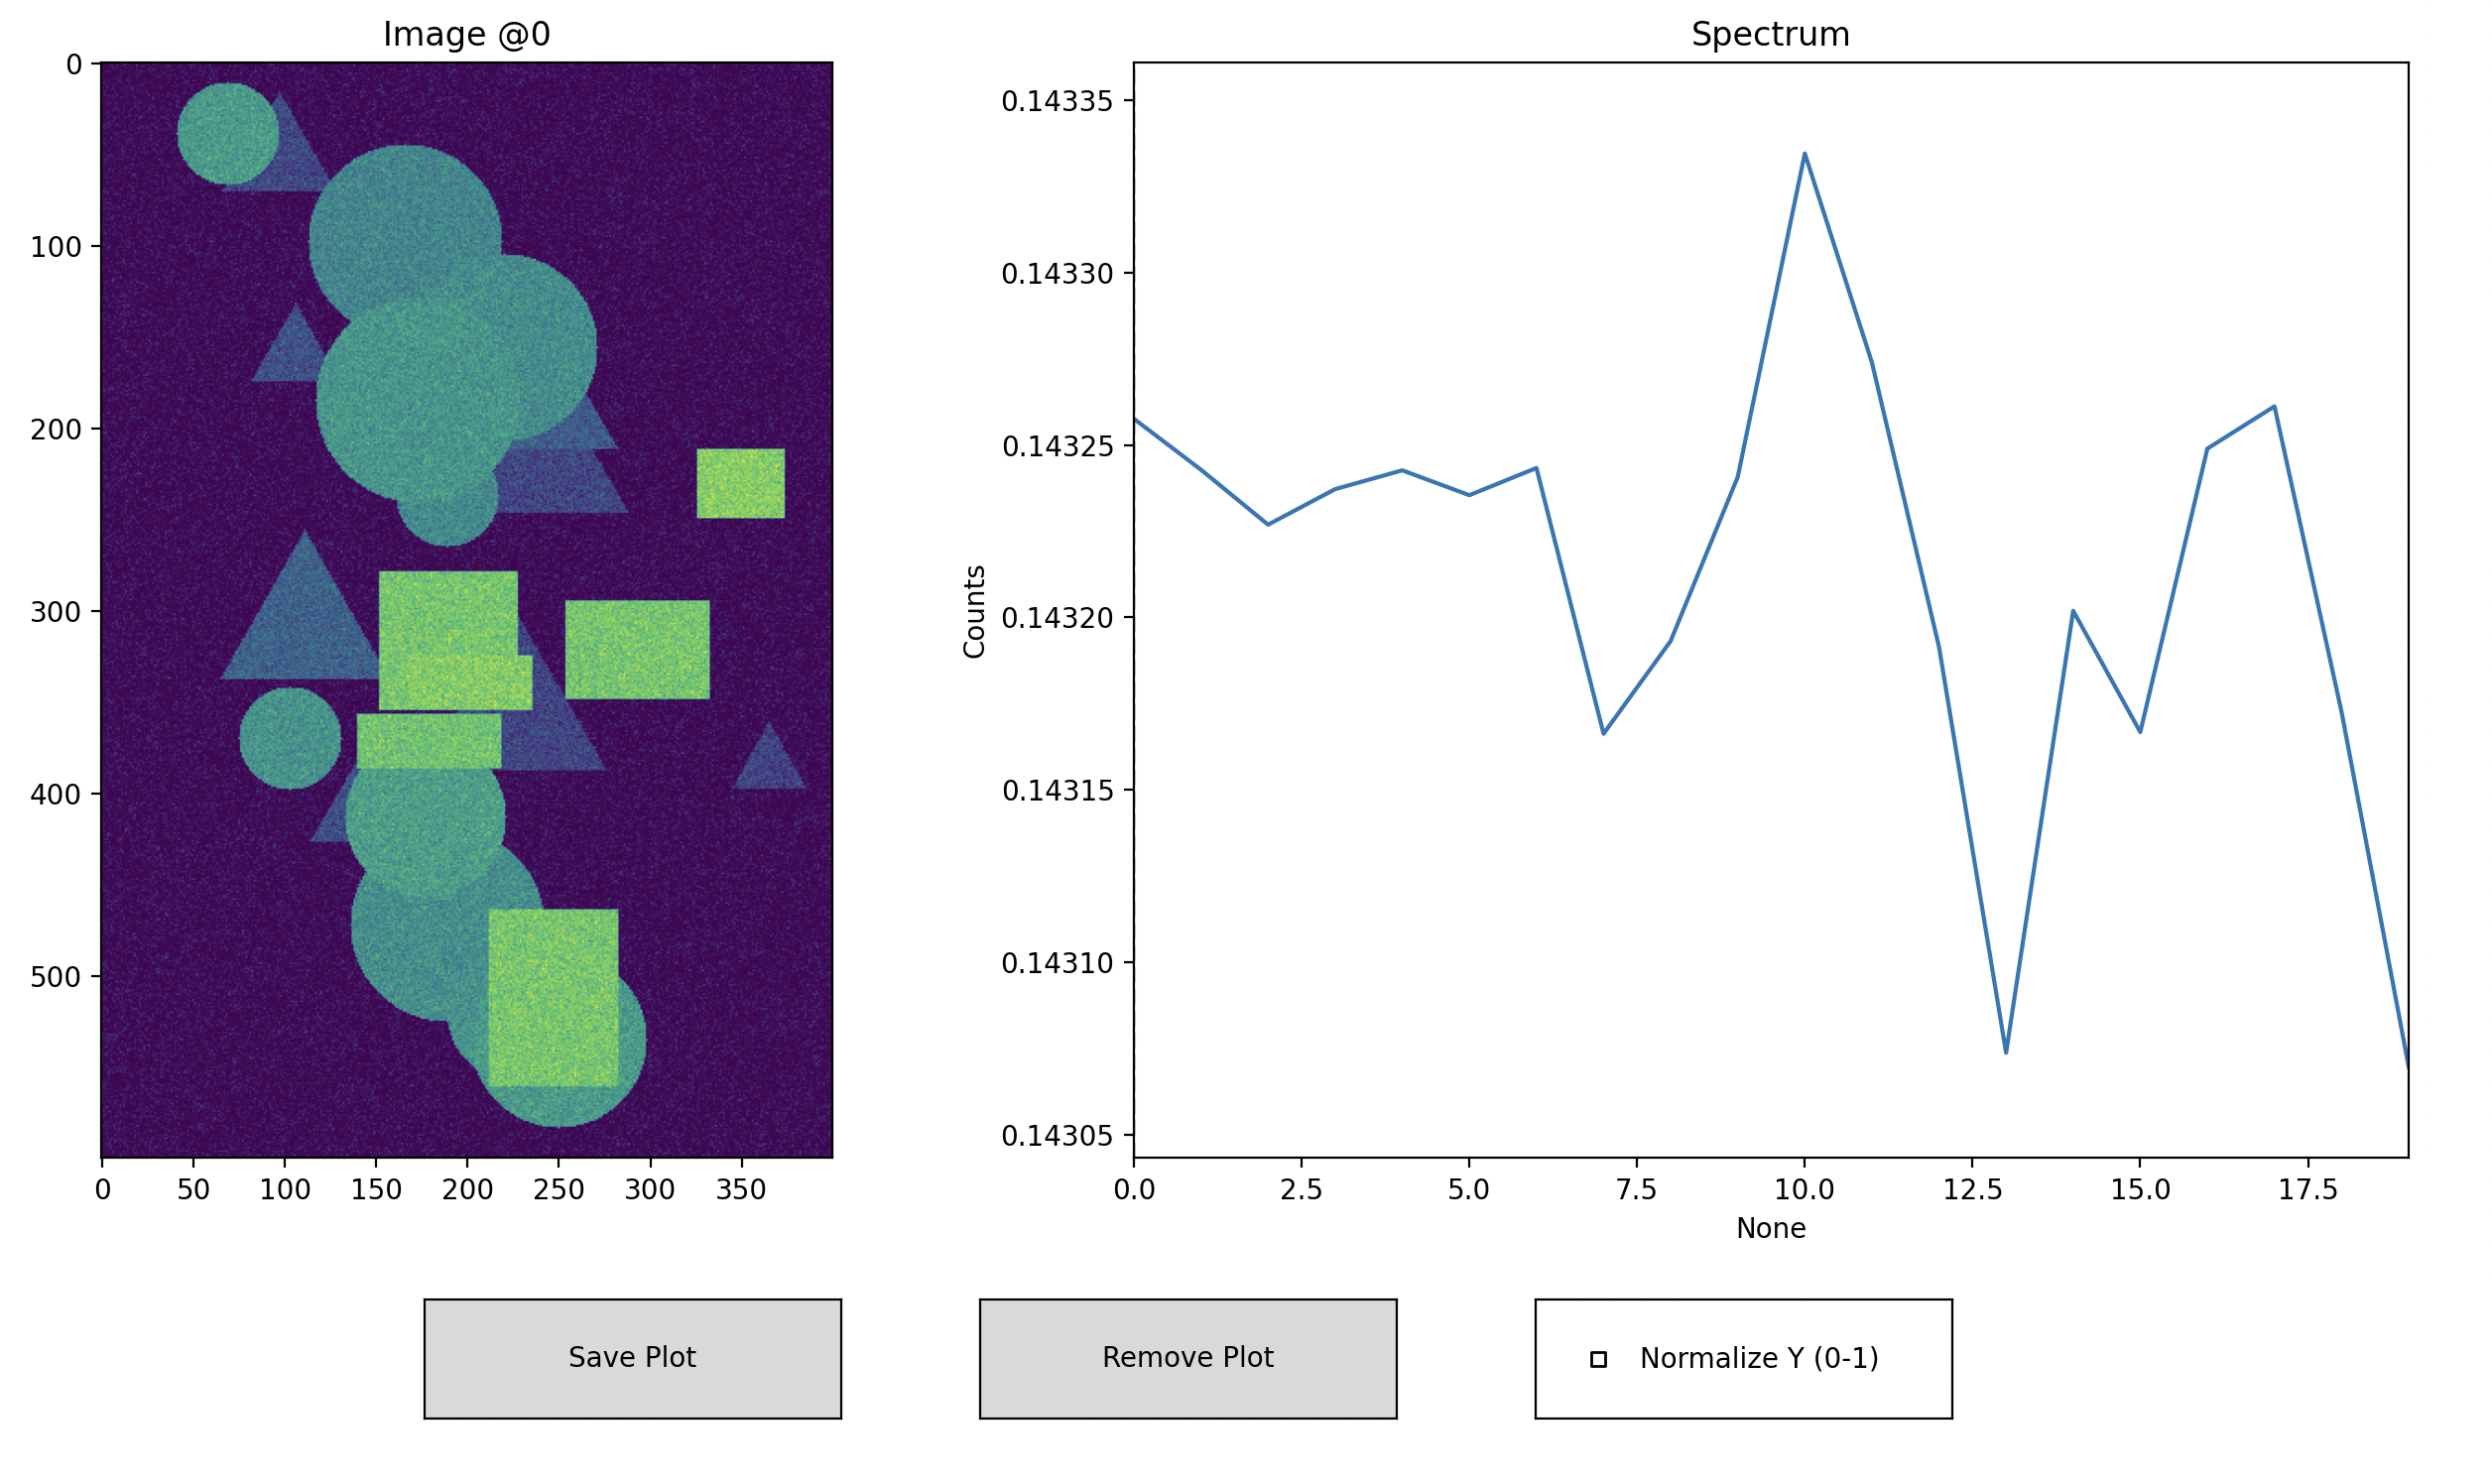
Interactive example of hyperspectral data visualization using the plotter function.